Distance Experiment
If you want to find the paper airplane that flies the furthest, you'll need to experiment with different designs and carefully select your paper. Let's figure out how to do this.
One of the most common questions that people have about paper airplanes, is "Which one flies the furthest?" There is no definitive answer to this question because there are many variables that affect the outcome. For example, an adult throwing hard against the wind and a child throwing gently indoors are two very different scenarios and the paper airplane that flies the furthest may not be the same in both cases.
The next section will outline some of the variables that affect flight, and the rest of this article will teach you how to experiment to figure out which paper airplanes fly the furthest for your particular scenario.
Variables that Affect Paper Airplanes
There are many variables that affect how paper airplanes fly. Some of these can be intuitively understood, but some may require experimentation to reach a conclusion. Keep in mind that each paper airplane design is different and may require different variables to maximize it's performance.
- Paper Size - Does a large or small airplane fly further?
- Paper Thickness - Does the thickness of the paper matter?
- Height of Throw - An airplane thrown from higher up will likely go further.
- Strength of Throw - An airplane thrown harder may go further, unless you throw it too hard and make the wings deform.
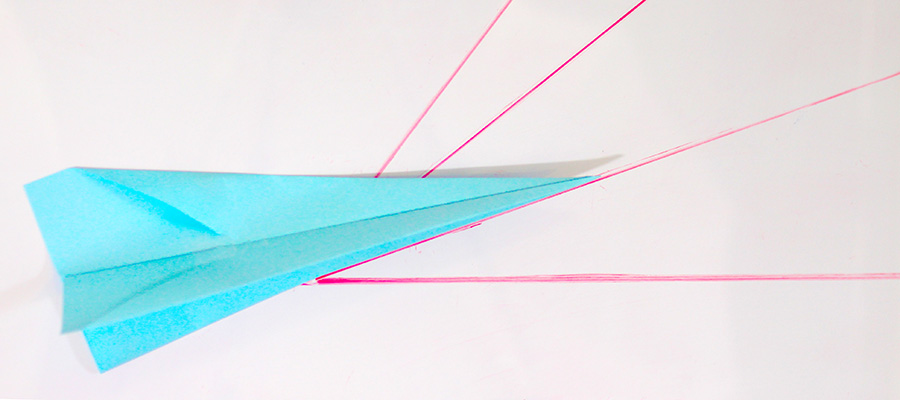
- Angle of Throw - What is the optimum angle to throw the airplane? Straight ahead, 30°, 45°, or something else?
- Wind - Throwing with the wind may help and against the wind may hurt. Throwing at an angle to the wind may make your airplane tip or turn.
- Center of Mass - Do you want the center of mass to be towards the front or the rear?
- Symmetry - Accurate folds improve symmetry. How much does symmetry affect the performance?
- Crisp Folds - Do crisp folds work better than gentle folds?
- Altitude - Places with higher elevation have lower air pressure. Does this make a difference?
Paper Airplane Distance Experiment
When you are conducting an experiment like this, it's important to alter only one variable at a time while keeping the other variables unchanged. For example, if you want to determine the best angle at which to throw the airplane, you wouldn't want to have two different people throwing the airplanes, because at the end of the experiment you wouldn't know if it was the angle or the person throwing the airplane that made the difference. Eliminating all of the other variables can sometimes be difficult. We recommending using a large indoor area because this is a reliable way to eliminate wind as a variable.
Before you start your experiment, it's a good idea to come up with a hypothesis. This is a guess or prediction about what you think is going to happen. For example, if you are experimenting with the angle of throw, you might make the hypothesis that throwing the paper airplane at 45° is the optimum angle for maximizing distance. Your experiment will then prove or disprove your hypothesis.
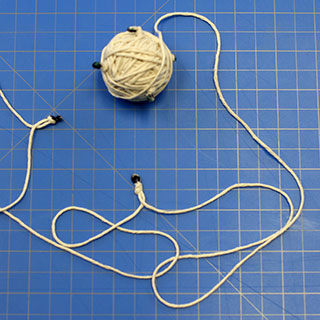
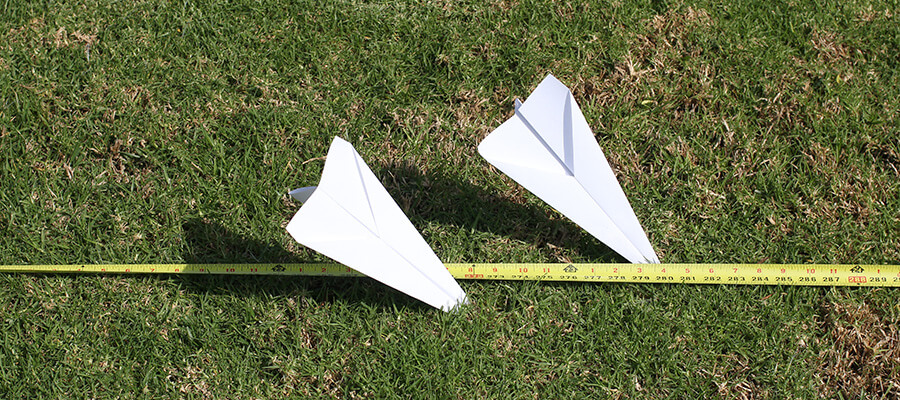
You'll also need a way to measure large distances. A tape measure will work. You can also use a piece of string with knots or marks at regular intervals.
Now it's time to throw some paper airplanes! For whichever variable you are experimenting with, you should pick a few different values. Throw your paper airplanes multiple times at each value to get a range of distances that you can average. For example, if you are experimenting with the angle of throw, you could try throwing straight ahead (0°), slightly angled up (20°), more angled (45°), and at a steep angle (70°). We recommend taking at least five measurements for each different value.
Remember to carefully write down all of your measurements so you can analyze and graph it latter.
Analyzing Your Results
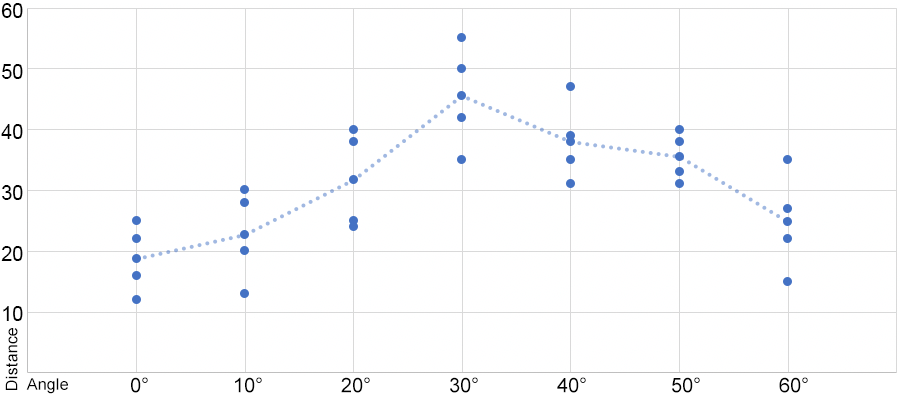
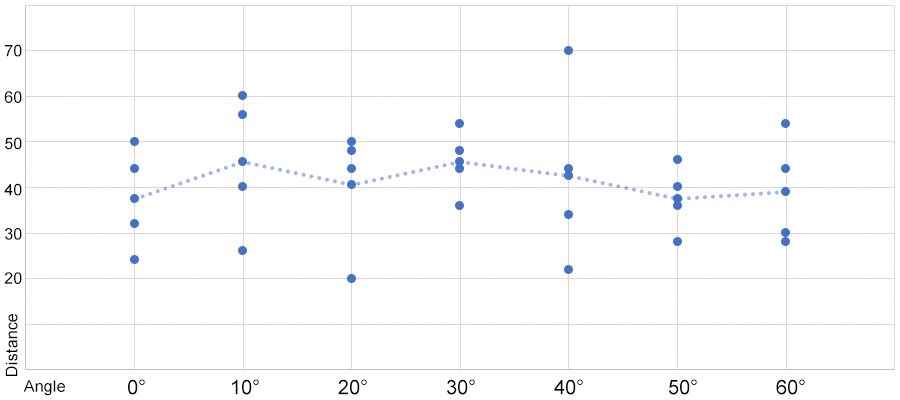
It's time to analyze the data and test your hypothesis. A nice way to do this is with a chart. Get a piece of graph paper and draw a blank chart with an x and y axis. The x-axis (horizontal) is going to be different values for the variable that you are experimenting with. The y-axis (vertical) is going to be the distance that each paper airplane flew. Mark each data point with a dot on the graph. For example, if a paper airplane was thrown at 20° and flew 40 feet, you would move along the x-axis to the 20° mark and then move up the y-axis to the 40 mark and draw your dot. Your graph may something like this. You can average the results for each value and draw a trend line.
If you collect more data, you can get a better picture of the trend. Collecting more data can mean making more throws at each point. This will make the average trend line more accurate. You can also collect more data by adding more values along the x-axis to test. Try some extreme values or try values in between two other values that have a big difference. This will increase the resolution of your graph.
Conclusion
If your graph looks like the one above, what conclusions can you make? It would appear that the values towards the middle performed better than the ones at the extremes. This means, that if you want to throw a paper airplane the furthest, you should use the middle value.
What if your graph had looked like the one below? This graph seems to show that there wasn't much difference in the distance that the airplane flew. The variable that you experimented with doesn't matter, at least in the way that you tested it. Maybe it would make a difference in another scenario.
Do your results confirm or disprove your hypothesis? If they confirm your prediction, then congratulations, you have an intuitive understanding of how that variable affects paper airplanes. If your results disprove your hypothesis, that's great! You just learned something new! Sometimes the best scientific experiments are the ones that have unexpected results.
There are many factors that can contribute to different results. If the experiment were repeated with different conditions, you could compare the results and perhaps reach a different conclusion and learn something else.
Each airplane design has unique aerodynamic properties. A different style of airplane may produce totally different results. You could repeat this experiment with a few different designs and see if you reach the same conclusion.
Congratulations! You just completed a paper airplane experiment!